
Mercator Projection: Why Greenland Looks So Big
The Mercator projection is a world map that keeps shapes and compass directions true but stretches land more and more toward the poles, so Greenland looks as big as Africa.
Last updated
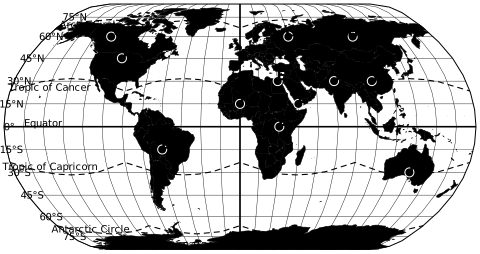
- Every red circle is the same size on the globe.
- At 60 degrees Mercator draws areas 4 times too large.
- Greenland is drawn about 16.4x its true size.
- Shapes and angles stay true, which is why sailors and web maps use it.
On this page
What is the Mercator projection?#
A map projection Map projection. A method for showing the round Earth on a flat map or screen. Every flat map distorts something: directions, distances, areas or shapes. Source is a rule for drawing the round Earth on a flat page. Gerardus Mercator published his in 1569 for sailors. Lines of latitude Latitude. Distance north or south of the equator, in degrees. Lines of latitude are always the same distance apart, about 111 km per degree. Source and longitude are straight and meet at right angles, so north is always straight up.
Its key property: any straight line on the map is a course of constant compass bearing. A navigator could draw a line from port to port, read the angle and steer by it. To make that work, the map keeps every small shape true. Mapmakers call this conformal.
Why Mercator distorts size#
On a globe, the lines of longitude meet at the poles. On a Mercator map they stay parallel, so land far from the equator is stretched east to west. To keep shapes true, the map stretches north to south by the same amount. Both stretches grow toward the poles, and areas grow with their product.
The red circles above show it. Each one is the same size on the globe. Near the equator they are small and round. Toward the poles they stay round but grow, and the poles themselves cannot be drawn at all. That is why Antarctica looks like an endless strip along the bottom of most world maps, and why Greenland, at about 73 degrees north, looks as big as Africa.
How much Mercator enlarges land#
"Lengths" is how much longer a distance looks than the same distance on the equator. "Areas" is how much larger land looks. The values come from the projection formula in the USGS map projection manual.
| Latitude | Lengths | Areas | Near |
|---|---|---|---|
| 0° | 1.0x | 1.0x | Quito |
| 15° | 1.0x | 1.1x | Dakar |
| 30° | 1.2x | 1.3x | Cairo |
| 45° | 1.4x | 2.0x | Bordeaux |
| 60° | 2.0x | 4.0x | Helsinki |
| 70° | 2.9x | 8.5x | North Cape |
| 75° | 3.9x | 14.9x | NW Greenland |
| 80° | 5.8x | 33.2x | Svalbard |
To see this with real countries, drag them across the map on the true size of countries map.
Mercator vs other projections#
No flat map keeps both shape and area. Compare the same world on Mercator and three other projections. Switch on the circles to see the stretch: where they stay the same size, the map shows true area, and where they bend into ovals, shapes are distorted.
- Gall-Peters keeps area. James Gall published it in 1855. Arno Peters presented a nearly identical map in 1967 as revolutionary and original. Shapes near the equator are stretched tall.
- Equal Earth keeps area too, with rounded sides that keep shapes closer to the globe. It was published in 2019.
- Natural Earth is a compromise. It keeps neither area nor shape exactly, but bends both only a little. Many of the world maps on this site use it.
Why Mercator is still used#
Because it keeps angles true, Mercator is still the base for sea charts. Web maps use it for a related reason. Google Maps draws its tiles in a Mercator projection: at street level, roads meet at their real angles and buildings keep their shape, and the square map tiles fit together at every zoom level.
The cost only shows when you zoom out to the whole world. For comparing countries, choose an equal-area map. For a wall map that keeps shapes readable, our political world map uses the Miller projection, a softened Mercator.
Key facts#
- Gerardus Mercator presented his projection in 1569 on a large wall map for sailors. Edward Wright published the tables to build it accurately in 1599. Snyder (1987), Map Projections: A Working Manual, USGS
- A straight line on a Mercator map is a rhumb line, a course of constant compass bearing. That is why navigators used it for centuries. Snyder (1987), Map Projections: A Working Manual, USGS
- At latitude φ, Mercator stretches every length by 1/cos φ and every area by its square. At 60 degrees lengths are doubled and areas are 4 times too large. Snyder (1987), Map Projections: A Working Manual, USGS
- The poles lie at infinity, so a Mercator map must stop short of them. Ours stops at 82 degrees north and south. Snyder (1987), Map Projections: A Working Manual, USGS
- Google Maps and most web maps use a Mercator projection for their tiles. Google Maps Platform, Map and tile coordinates
Mercator projection FAQ#
What is the Mercator projection?
Is Greenland bigger than Africa?
Why is the Mercator projection controversial?
Why is the Mercator projection still used?
Does Google Maps use the Mercator projection?
Which map projection is most accurate?
Sources: Snyder (1987), Map Projections: A Working Manual, USGS; Google Maps Platform, Map and tile coordinates; Šavrič, Patterson and Jenny (2019), The Equal Earth map projection.
 True size of countries
 Latitude and longitude map